Gnuplot und Statistik
Ich bin neulich bei Mastodon über eine Anfrage gestolpert, wie man online schnell eine graphische Darstellung statistischer Daten mit Mittelwert usw. anfertigen könnte. Ich gab dazu einige Suchparameter ergänzt um den Schlüsselbegriff "Gnuplot" ein und fand sofort einen Artikel, der erklärte, wie man das angefragte Szenario mittels Gnuplot umsetzen könnte.
Nachdem ich also die Frage mit Verweis auf den entsprechenden Artikel auf Mastodon beantwortet hatte, probierte ich die vorgeschlagene Lösung am nächsten Tag aus. Es stellte sich (wieder einmal) heraus, dass im Internet die Wahrheit nicht gerade zu Hause ist: Die vorgeschlagene Lösung funktionierte nicht.
Eine Lösung fand ich durch hartnäckiges Rumprobieren und Kombinieren der unten verlinkten Artikel selbst - angehängt findet man das entsprechende Gnuplot-Skript und das Ergebnis davon:
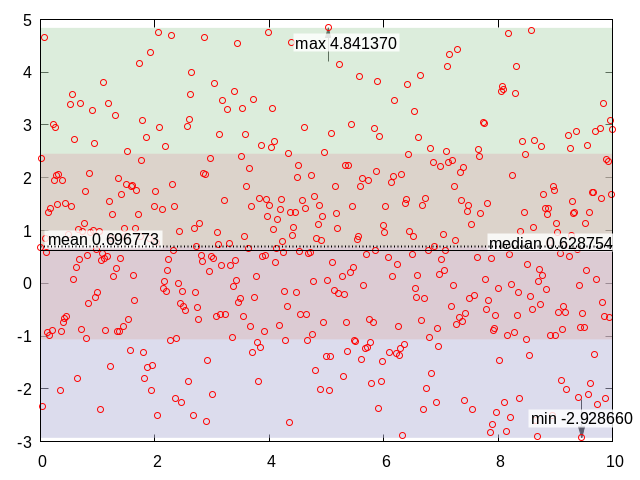 Gnuplot Statistik
reset
set terminal x11 enhanced font "terminal-14"
set term pngcairo font "Arial,12"
set output "/tmp/plot.png"

# This first part up to 'set yrange [0:2]' is just to generate some data
set sample 500
set table 'stats1.dat'
plot [0:10] 0.5+invnorm(rand(0))*2
unset table

unset key

set style fill transparent solid 0.5 noborder

set yrange [-3:5]
set style fill transparent solid 0.5 noborder
set style textbox opaque noborder fillcolor rgb "#30FFFFFF"

stats 'stats1.dat' u 1:2
show variables all
set arrow 1 from STATS_pos_min_y, graph 0.1 to STATS_pos_min_y, STATS_min_y fill
set arrow 2 from STATS_pos_max_y, graph 0.9 to STATS_pos_max_y, STATS_max_y fill
set label 1 at STATS_pos_min_y, graph 0.1 sprintf("min %f",STATS_min_y) center offset 0,-1 front boxed
set label 2 at STATS_pos_max_y, graph 0.9 sprintf("max %f",STATS_max_y) center offset 2,1 front boxed
set arrow 3 from graph 0, first STATS_median_y to graph 1, first STATS_median_y nohead front
set label 3 at graph 1, first STATS_median_y sprintf("median %f",STATS_median_y) right offset 0,0.4 front boxed
set arrow 4 from graph 0, first STATS_mean_y to graph 1, first STATS_mean_y nohead dt "." lw 2 front
set label 4 at graph 0, first STATS_mean_y sprintf("mean %f",STATS_mean_y) left offset 0.8,0.4 front boxed
#set label 5 at graph 0, first STATS_mean_y+STATS_stddev_y sprintf("{/Symbol s} %.2f",STATS_stddev_y) left offset 0.8,0.4 front boxed
plot STATS_min_y with filledcurves y1=STATS_mean_y lt 1 lc rgb "#bbbbdd", \
STATS_max_y with filledcurves y1=STATS_mean_y lt 1 lc rgb "#bbddbb", \
STATS_mean_y+STATS_stddev_y with filledcurves y1=STATS_mean_y-STATS_stddev_y lt 1 lc rgb "#ddbbbb", \
'stats1.dat' u 1:2 w p pt 6 lc rgb "#ff0000"
Links
Artikel, die hierher verlinken
GPS-(NMEA-)Tracks mit Gnuplot zu Animationen verarbeiten
02.11.2021
Durch einen Post auf Mastodon wurde ich auf eine Idee gebracht...


![]()
![]()


![]()
Vor 5 Jahren hier im Blog
-
Keycloak und LDAP
11.07.2021
Nachdem ich neulich bereits über die erfolgreiche Kopplung zwischen Keycloak und LDAP berichtete, bin ich noch einige Schritte weitergegangen...
Weiterlesen
Tags
AI und ML Android Basteln C und C++ Chaos Datenbanken Docker dWb+ ESP Wifi Garten Geo Go GUI Hardware Java Jupyter JupyterBinder Komponenten Links Linux Markdown Markup Music Numerik OpenSource PKI-X.509-CA Präsentationen Python QBrowser Rants Raspi Revisited Security Software-Test sQLshell TeleGrafana Verschiedenes Video Virtualisierung Windows Upcoming...
Neueste Artikel
-
SBOMs für alte Java-Projekte II
Ich habe bereits vor einiger Zeit eine Möglichkeit präsentiert, SBOMs aus alten Java-Projekten zu erstellen. Ich bin neulich einer speziellen Form von Java-Projekten begegnet, die mich dazu bewogen hat, mich auch hierfür an der (nachträglichen) Erstellung einer SBOM zu versuchen...
Weiterlesen -
Mini-QR und Silverbullet neu im Docker-Zoo
Ich habe eine weitere Alternative zum Aufnehmen von Notizen in meinen Docker-Zoo aufgenommen
Weiterlesen -
Neue Möglichkeiten zur Visualisierung von Modulverbindungen
Ich habe wieder einmal im Urlaub grundlegende Architekturänderung in meinem Framework, das auch die Grundlage für die sQLshell und dWb+ darstellt vorgenommen.
Weiterlesen
Manche nennen es Blog, manche Web-Seite - ich schreibe hier hin und wieder über meine Erlebnisse, Rückschläge und Erleuchtungen bei meinen Hobbies.
Wer daran teilhaben und eventuell sogar davon profitieren möchte, muss damit leben, daß ich hin und wieder kleine Ausflüge in Bereiche mache, die nichts mit IT, Administration oder Softwareentwicklung zu tun haben.
Ich wünsche allen Lesern viel Spaß und hin und wieder einen kleinen AHA!-Effekt...
PS: Meine öffentlichen Codeberg-Repositories findet man hier.